Whale & Institutional Flows: Who Really Moves Bitcoin?
ETF flows now exceed daily mining supply by 12x. Whale wallets are at all-time highs. Yet Bitcoin sits 54% below power law fair value. We analyzed institutional flow data to understand what actually drives price.
This analysis uses publicly available research and on-chain data. Past correlations do not guarantee future price movements. This is not financial advice.
The Core Question
Does institutional flow data explain Bitcoin price better than the power law model? If ETF and whale flows now dominate, should we weight our models toward demand-side dynamics over time-based regression?
Current Position: Power Law Deviation
Power Law Status (March 2026)
At -54% deviation, we're approaching historically rare territory. The only comparable periods were the March 2020 COVID crash and the November 2022 FTX collapse. Both preceded major rallies.
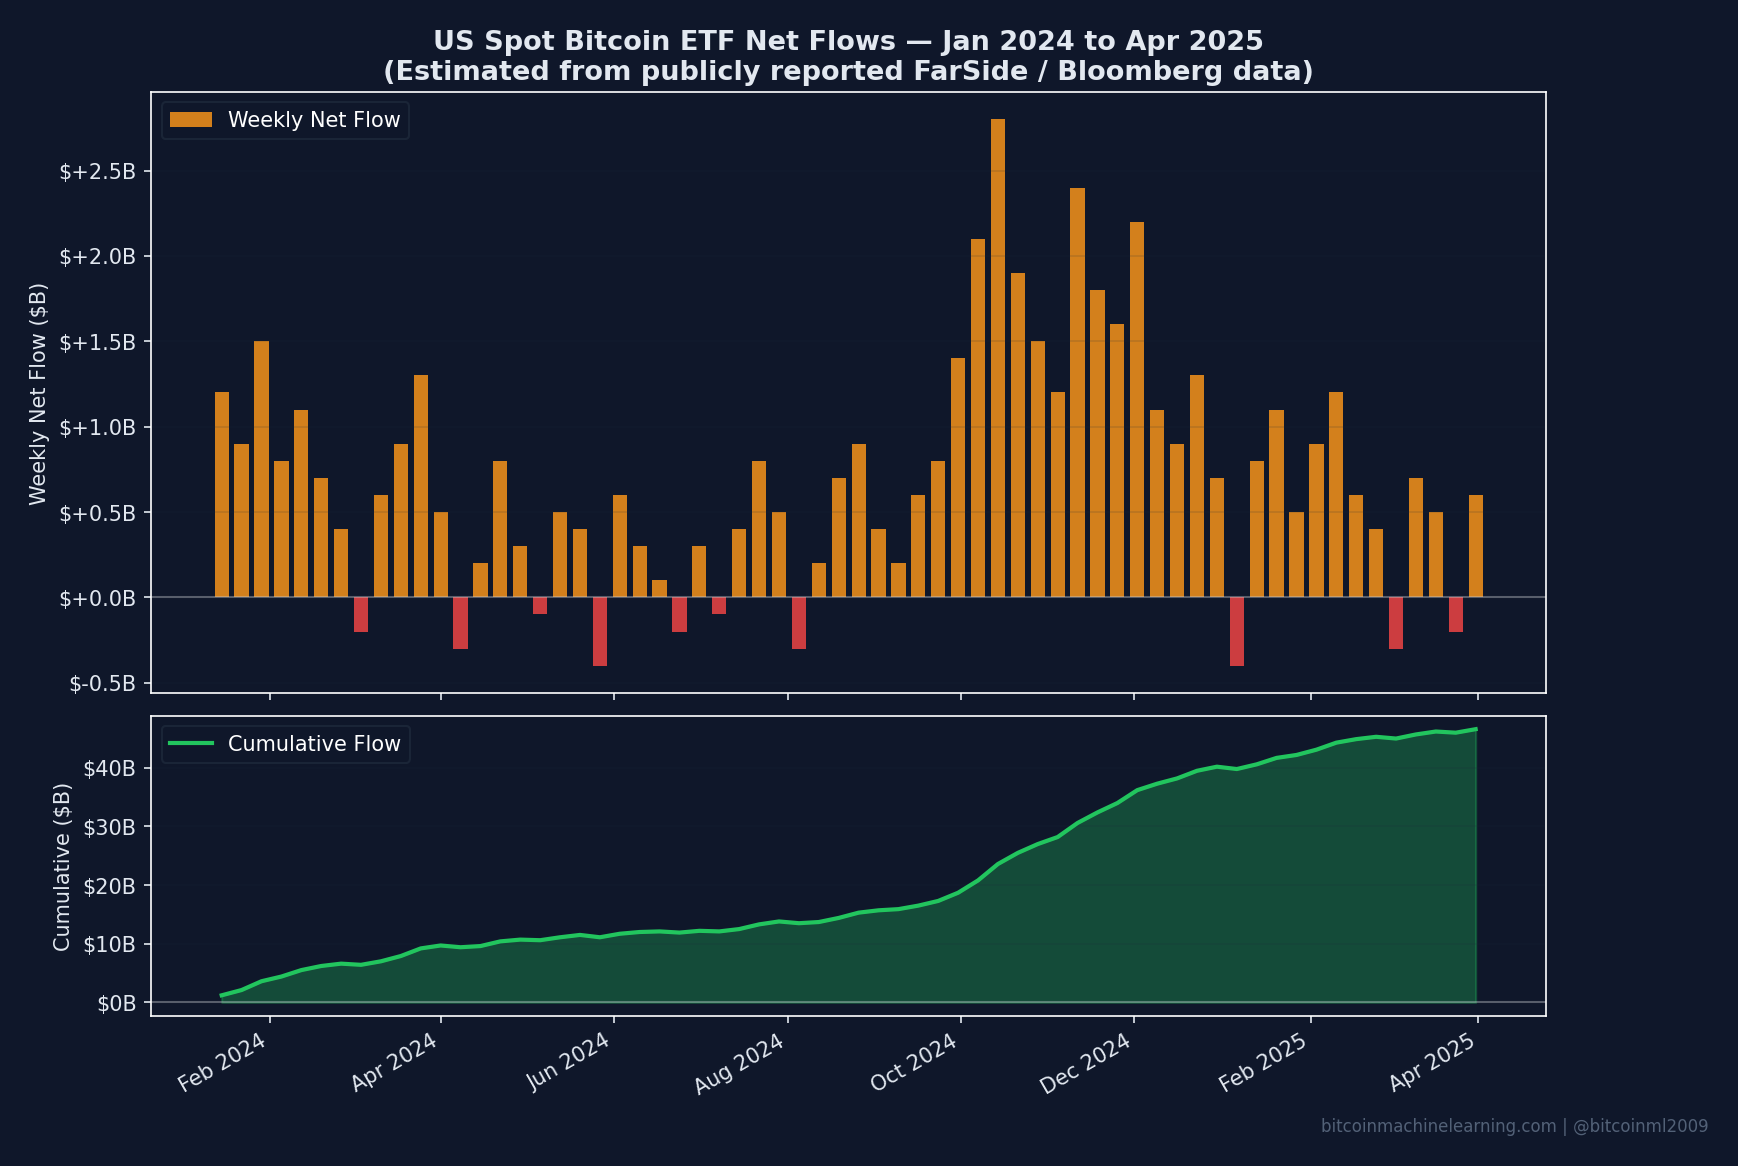
ETF Flow Dominance
Since Bitcoin spot ETFs launched in January 2024, institutional flows have fundamentally changed market dynamics.
| Metric | Value | Implication |
|---|---|---|
| ETF Daily Flows (avg) | $500M+ | Massive demand pressure |
| Daily Mining Supply | ~450 BTC ($40M) | Fixed by protocol |
| Flow/Supply Ratio | 12.5x | ETFs absorb 12x what miners produce |
From ScienceDirect: "On average, a 3.4% change in Bitcoin's price corresponds to a 0.2% net fund flow." This suggests flows follow price short-term, but drive price long-term via supply absorption.
May 2025 Imbalance Event
During May 2025, ETFs purchased 26,700 BTC while miners produced only 7,200 BTC—a ratio of 3.7x to 6x depending on the week. This level of absorption creates structural supply deficits.
Whale Accumulation: All-Time Highs
Whale Metrics (March 2026)
"Whale buying often precedes bullish runs. Coins taken off exchanges reduce sellable supply, fueling price surges."
— CryptoQuant Research
At 20,031 wallets holding >100 BTC, whale accumulation is at record levels despite Bitcoin being -24% YTD. This suggests strong conviction among large holders.
Retail vs Institutional Ownership
Who actually owns Bitcoin? The breakdown matters for understanding price dynamics.
| Holder Type | % of Supply | BTC Amount |
|---|---|---|
| Retail Individuals | 66% | 13.83M BTC |
| Institutions (narrow) | 8% | 1.67M BTC |
| Institutions (broad) | 17-31% | 3.6-6.5M BTC |
Retail still dominates with 66% of supply. This has implications for price behavior during crashes.
The 2025-2026 Crash: Institutions Sold
Contrary to the "institutions only accumulate" narrative, the 2025-2026 crash saw significant institutional selling.
ETF Outflows (2025-2026)
For the first time since launch, spot Bitcoin ETFs have flipped to net sellers. When ETF holders are underwater, it creates self-reinforcing selling pressure.
Stock-to-Flow vs Power Law
How do the competing models stack up?
| Model | Prediction | Reality | Status |
|---|---|---|---|
| Stock-to-Flow | $1.3M per BTC | $66K | Invalidated (95%+ miss) |
| Power Law | $144K fair value | $66K | Stressed but holding (-54%) |
The power law has not broken its historical envelope. Stock-to-Flow has. This is the critical distinction.
Synthesis: Flows vs Power Law
The Working Hypothesis
The power law may define the corridor, but flows determine where within that corridor price trades.
- High flows: Price approaches upper band (+2σ)
- Low flows: Price approaches lower band (-2σ)
- Extreme absorption: Potential to break upper band (supercycle scenario)
The Current Paradox
| Signal | Reading | Interpretation |
|---|---|---|
| Whale Accumulation | ATH | Bullish |
| Power Law Deviation | -54% | Historically bullish zone |
| ETF Flows | Net negative | Bearish |
| Price YTD | -24% | Bearish |
Possible explanations for the divergence:
- Macro risk: Geopolitical uncertainty overriding fundamentals
- Rotation: Flight to defensive assets
- Lagging indicator: Flows predict future, not present price
Implications for Modeling
Whale/institutional accumulation is bullish ONLY when accompanied by price stability. During crashes, institutions become sellers, not buyers. The "smart money always buys" narrative is false.
Proposed Multi-Factor Approach
Based on this research, a comprehensive model should include:
- Power law base: Time-based trend (still explains 96%)
- Halving phase: Cycle position (28.2% factor importance)
- ETF flow momentum: Demand-side dynamics
- Whale ratio: Large holder sentiment
- Macro risk index: Volatility regime
Track the Data
Monitor power law deviation, halving cycle phase, and valuation metrics in real-time.
View Dashboard →Related Reading
- Bitcoin's Power Law Model — The math behind 96% of price history
- 200 MA Statistical Analysis — Where Bitcoin sits in historical distribution
- Halving Cycle Guide — Understanding the 4-year rhythm
Data: March 2026. Analysis based on publicly available research.
Sources:
- Ledger Journal - ETF Cointegration Study
- Fidelity - 2024 Halving One Year Later
- MDPI - Supply Demand Framework
- CryptoQuant - Whale Ratio
- BeInCrypto - Whale Accumulation
- CoinDesk - ETF Outflows
Disclaimer: This is not financial advice.