Bitcoin Halving Cycle Explained: When to Buy and When to Sell
We analyzed over 10 years of Bitcoin price data to understand what actually drives returns. The answer isn't whale wallets or Fed policy—it's the halving cycle. Here's exactly when to buy and when to reduce exposure.
Key Finding
What Is the Bitcoin Halving?
Every 210,000 blocks (approximately every 4 years), Bitcoin's block reward is cut in half. This is hard-coded into Bitcoin's protocol and cannot be changed. The resulting supply shock has historically preceded major price appreciation—and the timing is predictable.
| Halving | Date | Price at Halving |
|---|---|---|
| Halving 1 | Nov 28, 2012 | ~$12 |
| Halving 2 | Jul 9, 2016 | ~$650 |
| Halving 3 | May 11, 2020 | ~$8,600 |
| Halving 4 | Apr 19, 2024 | ~$64,000 |
| Halving 5 (est.) | ~Feb 5, 2028 | TBD |
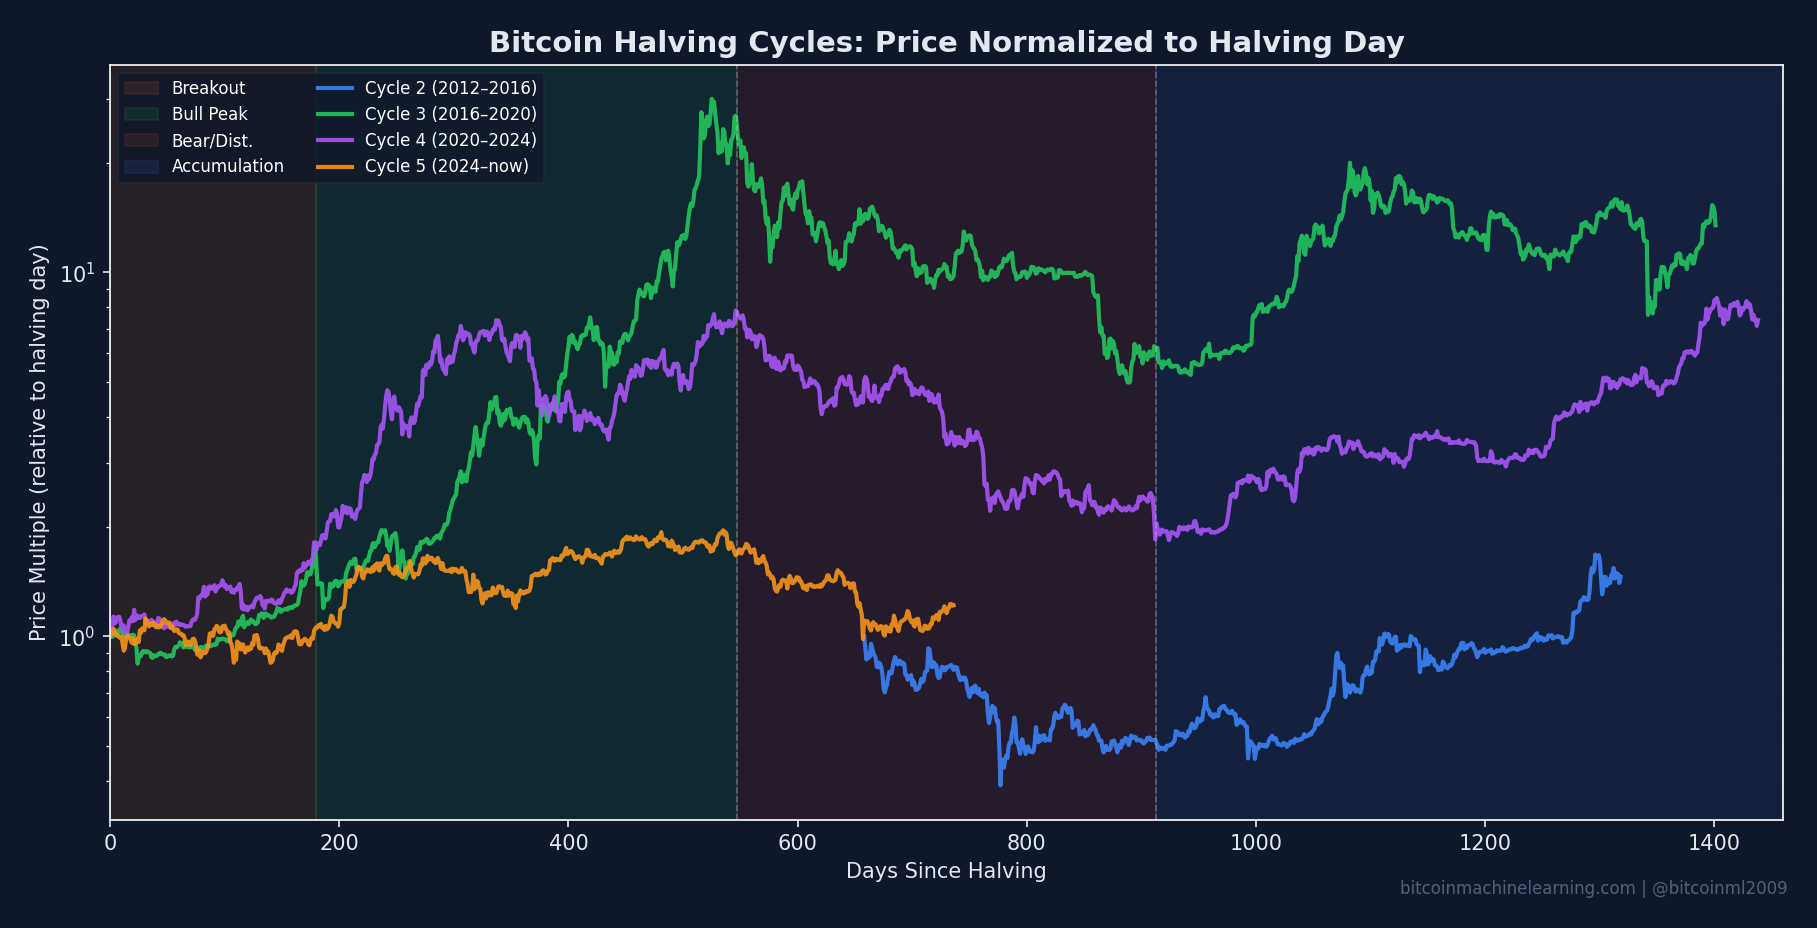
The Three Phases of Each Halving Cycle
Our analysis of historical data reveals that each ~4-year halving cycle follows a consistent three-phase pattern. Understanding which phase you're in is more predictive of future returns than almost any other factor.
Phase 1: Best Time to Accumulate (Pre-Halving)
The 18 months before each halving is historically the best risk-adjusted entry point. Smart money begins accumulating in anticipation of the coming supply shock. Returns are strong and consistent across all three measured cycles.
Pre-Halving Phase Statistics
| Cycle | Pre-Halving Return |
|---|---|
| Cycle 2 (2015-2016) | +65.50% |
| Cycle 3 (2018-2020) | +37.63% |
| Cycle 4 (2022-2024) | +64.20% |
Phase 2: When Bitcoin Peaks (Post-Halving Bull)
This is where the supply shock takes full effect. With new supply cut in half and demand constant or rising, the post-halving bull phase delivers the strongest returns of the cycle. However, note the clear trend of diminishing returns each cycle.
Post-Halving Bull Phase Statistics
| Cycle | Bull Phase Return |
|---|---|
| Cycle 2 (2012-2014) | +172.14% |
| Cycle 3 (2016-2018) | +112.56% |
| Cycle 4 (2024-2025) | +31.07% |
Bull phase returns are clearly declining each cycle: +172% → +112% → +31%. As Bitcoin matures and market cap grows, the percentage gains compress. The post-halving bull is still the strongest phase, but expecting 100%+ returns going forward may be unrealistic.
Bitcoin has historically peaked approximately 500-550 days after each halving:
- Cycle 1 peak: ~367 days post-halving (Nov 2013)
- Cycle 2 peak: ~525 days post-halving (Dec 2017)
- Cycle 3 peak: ~546 days post-halving (Nov 2021)
Phase 3: When to Reduce Exposure (Distribution/Bear)
After the cycle peak, early investors take profits and the market enters a bear phase. This is historically the worst phase by far—returns are deeply negative and drawdowns severe. The data is unambiguous: this is when to reduce exposure, not accumulate.
Distribution/Bear Phase Statistics
| Cycle | Bear Phase Return |
|---|---|
| Cycle 2 (2014-2015) | -57.38% |
| Cycle 3 (2018-2019) | -77.38% |
| Cycle 4 (2025-2026) | -72.91%* |
*Cycle 4 distribution phase is still in progress. Return reflects data through March 2026.
The distribution/bear phase has delivered -68.28% annualized returns with max drawdowns exceeding -91%. Every cycle. Buying during this phase means fighting the strongest structural headwind in Bitcoin's cycle.
Why the Halving Cycle Dominates Other Factors
We conducted a factor hierarchy analysis to determine what actually predicts Bitcoin's 90-day returns. Using ANOVA (analysis of variance) on over 900 data points, we measured each factor's explanatory power.
| Rank | Factor | Eta-Squared | p-value |
|---|---|---|---|
| #1 | Halving Cycle Phase | 28.2% | 3.4e-68 |
| #2 | Power Law Valuation | 16.9% | 1.6e-36 |
| #3 | Fed Regime | 9.4% | 5.1e-22 |
Key insight: The halving cycle phase explains nearly 3x more variance in 90-day returns than valuation metrics, and 3x more than Fed policy. For the complete factor ranking with combined scenario analysis, see our Factor Hierarchy deep dive →
When Should I Buy Bitcoin?
Based on our analysis of three complete halving cycles, here's what the data says about timing:
- Best time: Pre-halving phase (+55.71% annualized). The 18 months before a halving offers the best risk-adjusted returns. The next pre-halving window opens ~August 2026.
- Second best: Early post-halving bull (+105.26% annualized). The highest raw returns, but timing the exit is critical—peaks come ~500-550 days post-halving.
- Worst time: Distribution/bear phase (-68.28% annualized). This is where we are now (March 2026). Every dollar deployed here has historically faced severe drawdowns.
- Now (March 2026): Distribution/bear phase — 696 days post-halving
- ~August 2026: Pre-halving accumulation window opens (~144 days away)
- ~February 5, 2028: Estimated Halving 5
- ~July 2029: Estimated Cycle 5 peak (500-550 days post-halving)
Cycle-by-Cycle Comparison
Here's how each phase has performed across all three measured cycles:
| Phase | Cycle 2 | Cycle 3 | Cycle 4 | Avg Ann. Return |
|---|---|---|---|---|
| Pre-Halving | +65.50% | +37.63% | +64.20% | +55.71% |
| Post-Halving Bull | +172.14% | +112.56% | +31.07% | +105.26% |
| Distribution/Bear | -57.38% | -77.38% | -72.91%* | -68.28% |
*Cycle 4 distribution phase still in progress.
The pattern is remarkably consistent. Pre-halving returns are stable (37-65%), bear phases always deliver large losses (-57% to -77%), and bull phases are strong but diminishing (172% → 112% → 31%).
Where Are We Now? (March 2026)
Current Cycle Position
We are 696 days into Cycle 4, deep in the distribution/bear phase. This phase has averaged -68.28% annualized across all cycles. The market is trading ~45% below the power law fair value estimate—consistent with typical bear phase behavior.
The accumulation window for Cycle 5 opens in approximately 144 days (~August 2026) when the pre-halving phase begins. Historically, this is when risk-adjusted returns improve dramatically.
Key Takeaways: When Does Bitcoin Peak?
- The halving cycle is the #1 predictor of Bitcoin's 90-day returns, explaining 28.2% of variance—3x more than valuation or Fed policy.
- Best buy window: pre-halving phase (+55.71% annualized). Next window: August 2026.
- Peaks occur ~500-550 days after halving. For Cycle 5, that targets ~mid-2029.
- We're in the worst phase right now: distribution/bear averages -68.28% annualized with drawdowns exceeding -91%.
- Bull returns are diminishing each cycle (172% → 112% → 31%). The cycle still works, but with compressed upside.
Track the Cycle in Real-Time
Our free dashboard shows the current cycle position, power law deviation, and phase analysis—updated daily.
View DashboardMethodology
This analysis uses data from January 2015 to March 2026 (4,072 daily observations). Factor importance was measured using ANOVA with eta-squared as the effect size metric. Phase returns are calculated using annualized compound returns. Cycle-by-cycle returns represent total phase returns, not annualized.
Disclaimer: This is statistical analysis of historical patterns, not financial advice. Past patterns do not guarantee future results. Always do your own research.