Bitcoin 200 MA Analysis: Where Does Price Sit Statistically?
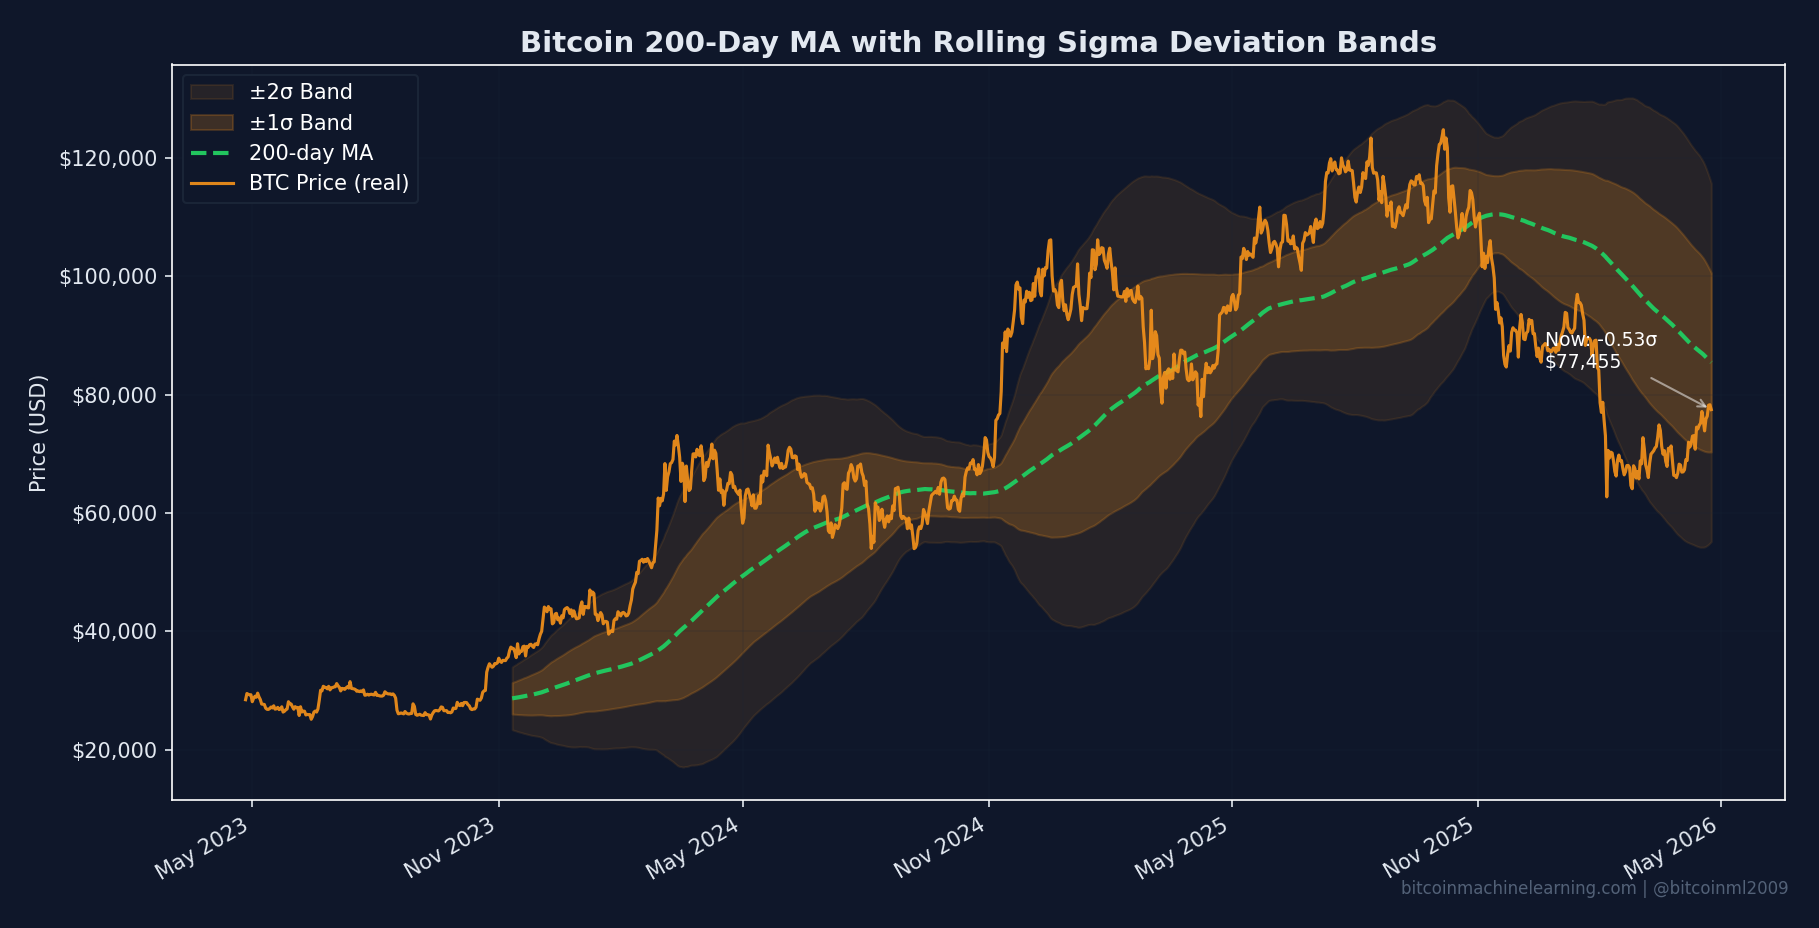
We analyzed 3,895 days of Bitcoin price data against the 200-day moving average. Current position: -22.6% below the MA, a -1.0 sigma deviation. Only 12.5% of Bitcoin's history has been worse.
Past performance does not guarantee future results. This analysis describes historical patterns only. Statistical fit to past data does not imply predictive accuracy. This is not financial advice.
Current Position
As of March 16, 2026
The percentile tells us that only 12.5% of Bitcoin's history has seen worse deviation from the 200 MA. We're in statistically rare territory.
What Is the 200 MA?
The 200-day moving average (200 MA) is one of the most widely followed indicators in traditional finance. It represents the average closing price over the past 200 trading days.
When price trades above the 200 MA, the asset is generally considered to be in an uptrend. When price trades below the 200 MA, it's considered to be in a downtrend.
But we can go deeper than simple above/below analysis. By calculating the statistical distribution of deviations from the 200 MA, we can understand where any given price sits in historical context.
Sigma Bands Explained
We calculated standard deviation bands around the mean deviation from the 200 MA:
| Band | Deviation % | Interpretation |
|---|---|---|
| +2 Sigma | +101.8% | Extreme overvaluation (bubble) |
| +1 Sigma | +60.2% | Extended / overbought |
| Mean | +18.7% | Historical average |
| -1 Sigma | -22.8% | Undervalued (current zone) |
| -2 Sigma | -64.4% | Extreme fear |
Bitcoin has never touched the -2 sigma band in its entire history. The current -1 sigma zone represents the lower end of Bitcoin's normal trading range.
Zone Distribution
How does Bitcoin distribute its time across these zones?
| Zone | Time Spent | Current? |
|---|---|---|
| Below -2 Sigma | 0.0% | |
| -2 Sigma to -1 Sigma | 12.4% | Yes |
| -1 Sigma to Mean | 46.3% | |
| Mean to +1 Sigma | 28.3% | |
| +1 Sigma to +2 Sigma | 7.7% | |
| Above +2 Sigma | 5.4% |
Bitcoin spends nearly half its time (46.3%) in the -1 sigma to mean range, and another 28% between mean and +1 sigma. The current zone (-2 to -1 sigma) sees only 12.4% of historical time.
Historical Extremes
All-Time Deviation Records
The worst deviation occurred during the June 2022 crash following the Luna/FTX collapses. The best occurred at the peak of the 2017 bubble. Current levels (-22.6%) are closer to historical lows than highs, but not at extremes.
Comparison with Power Law
How does the 200 MA analysis compare to our power law model?
| Metric | 200 MA | Power Law |
|---|---|---|
| Current Deviation | -22.6% | -54% |
| Z-Score | -1.0 sigma | ~-1.5 sigma |
| Percentile | 12.5% | ~5% |
| Signal | Moderately undervalued | Severely undervalued |
Both indicators agree that Bitcoin is below its historical mean. The power law shows a more severe undervaluation because it measures deviation from a long-term growth trend rather than a trailing average.
Methodology
Data & Calculations
- Data Source: Yahoo Finance (BTC-USD)
- Period: July 18, 2015 to March 16, 2026 (3,895 days)
- Indicator: 200-day Simple Moving Average
- Deviation Formula:
(Price - SMA_200) / SMA_200 × 100 - Sigma Bands: Mean ± (n × Standard Deviation)
Open Source
All code and data for this analysis is open source and reproducible:
# Clone the repository
git clone https://github.com/bitcoinml/btc-ma200-analysis

# Run the analysis
python ma200_deviation_analysis.py --output results.json
The script can fetch fresh data via yfinance or use local CSV files. Full documentation in the repository README.
Track Bitcoin's Position Live
Monitor the 200 MA deviation and power law metrics in real-time on our dashboard.
View Dashboard View CodeKey Takeaways
- Current position is rare: Only 12.5% of Bitcoin's history has seen worse 200 MA deviation.
- Bitcoin has never hit -2 sigma: The extreme fear zone remains untouched historically.
- Time distribution favors mean reversion: Bitcoin spends 46% of time between -1 sigma and the mean.
- Both indicators agree: 200 MA and power law both show undervaluation, differing only in severity.
Statistical undervaluation does not guarantee future price increases. Markets can remain irrational longer than you can remain solvent. Always do your own research and never invest more than you can afford to lose.