Bitcoin's Power Law Model: The Math Behind 96% of Price History
Bitcoin follows a mathematical pattern that explains 96% of its price history. Not a crystal ball. Not a trading signal. Just a remarkably consistent relationship between time and price.
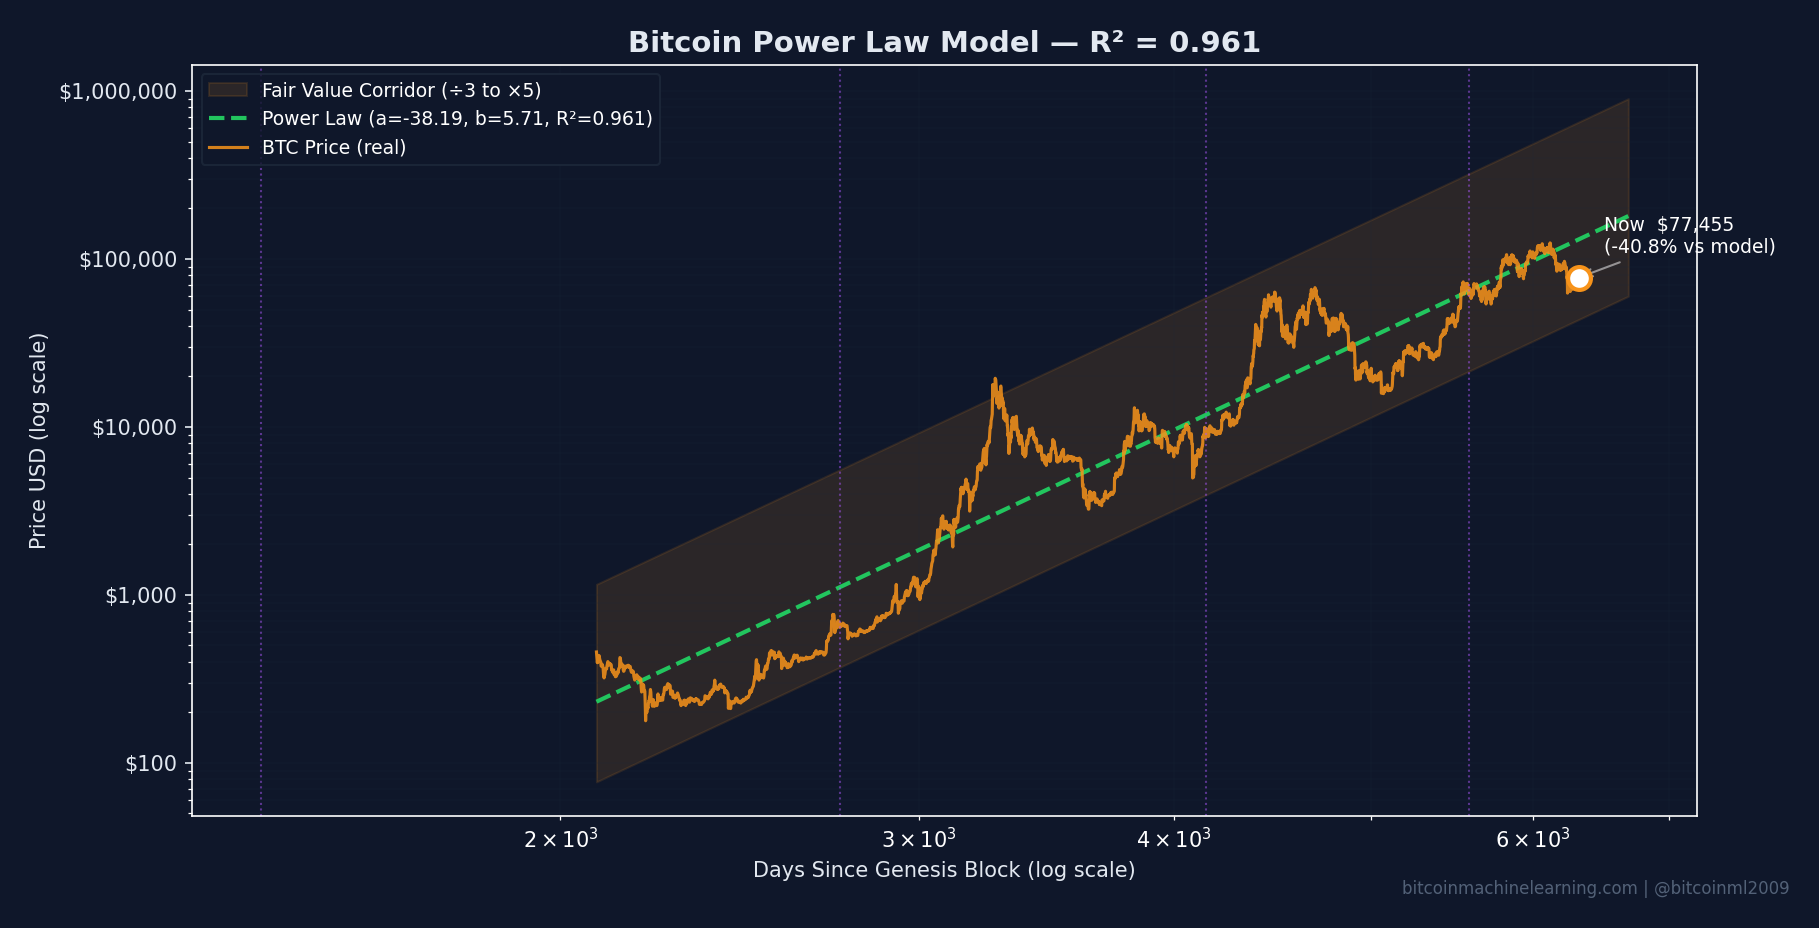
Interactive Power Law Chart
Explore the power law model on TradingView. Zoom, pan, and analyze the historical fit.
Open Full Chart in TradingView → Add our Power Law indicator: Search "Bitcoin Power Law Model" in TradingView indicators
Past performance does not guarantee future results. This analysis describes historical patterns in a complex adaptive system. Statistical fit to past data does not imply predictive accuracy.
What Is the Power Law?
A power law describes a relationship where one quantity varies as a power of another. For Bitcoin, the relationship is:
log(price) = a + b × log(days since genesis)On a log-log scale, this produces a straight line. Bitcoin's price, when plotted this way, hugs this line with surprising consistency.
Why does this work? Network effects. As more people adopt Bitcoin, its value increases non-linearly. This pattern appears in other network-driven technologies—internet adoption, social media growth, and telecommunications all follow similar curves.
Our Model: The Diminishing Sine
The pure power law captures the long-term trend, but Bitcoin doesn't move in a straight line. It oscillates—dramatically at first, then less so over time.
Our model adds a cyclical component that dampens with each halving: Power Law + Diminishing Sine Wave
The key insight: each cycle shows less extreme deviation from the trend than the last.
| Model Variant | R² | Fit Quality |
|---|---|---|
| Pure Power Law | 0.915 | Good |
| Power Law + Constant Sine | 0.956 | Better |
| Power Law + Diminishing Sine | 0.961 | Best |
The diminishing sine model achieves R² = 0.9605—meaning it explains 96% of Bitcoin's historical price variance.
Key Parameters
Model Parameters
The amplitude half-life means each halving cycle shows roughly 33% less deviation from the trend than the previous cycle.
Amplitude Decay by Halving
| Halving | Date | Amplitude |
|---|---|---|
| 1st | 2012-11-28 | 1.166 |
| 2nd | 2016-07-09 | 0.800 |
| 3rd | 2020-05-11 | 0.536 |
| 4th | 2024-04-19 | 0.356 |
Bitcoin's volatility is decreasing systematically, not randomly.
Fair Value Calculation
The model produces a "fair value" estimate at any point in time—the price Bitcoin would be at if it sat exactly on the power law trend.
Current Model Output
When price sits below the trend line, the model suggests Bitcoin is "undervalued" relative to its historical pattern. When above, "overvalued."
Historical Deviations
Plotting standard deviation bands around the power law reveals consistent patterns:
- At Cycle Peaks: Price reaches +2σ to +3σ above the trend (every major top)
- At Cycle Bottoms: Price drops to -1σ to -2σ below the trend (accumulation phases)
- Current Position: Approaching -2σ territory (similar to previous accumulation zones)
This doesn't predict future prices. It contextualizes where current price sits relative to the historical range.
What the Model Tells Us
- Bitcoin's growth is decelerating over time — the curve flattens on a linear scale as adoption matures
- Volatility is decreasing systematically — each cycle is less extreme than the last
- There's a consistent attractor — price oscillates around the trend but reverts to it over multi-year periods
- Time is the dominant variable — days since genesis explains more variance than most fundamental metrics
Limitations
A high R² for historical data does not guarantee the pattern continues. Bitcoin operates within a complex adaptive system where market participants, regulations, and technology co-evolve in ways that mathematical models cannot capture.
The relationship could break down due to:
- Regulatory changes
- Technological disruption
- Macro economic shifts
- Black swan events
Use the power law as context, not as a trading signal. It shows where price sits relative to historical patterns—nothing more.
See It Live
Track Bitcoin's power law deviation in real-time. Updated daily with fair value, deviation bands, and historical overlays.
View Power Law Dashboard →Related Reading
- Understanding Bitcoin's Halving Cycles — How the 4-year cycle drives returns
- Factor Hierarchy: What Actually Moves Bitcoin Price? — Full ranking of halving, valuation, and Fed policy by statistical effect size
Data: March 2026. Model parameters from diminishing sine power law analysis.
Sources: Metcalfe's Law (Economics Letters, 2018), Power Laws in Economics (JEP, 2016)
Disclaimer: This is not financial advice.